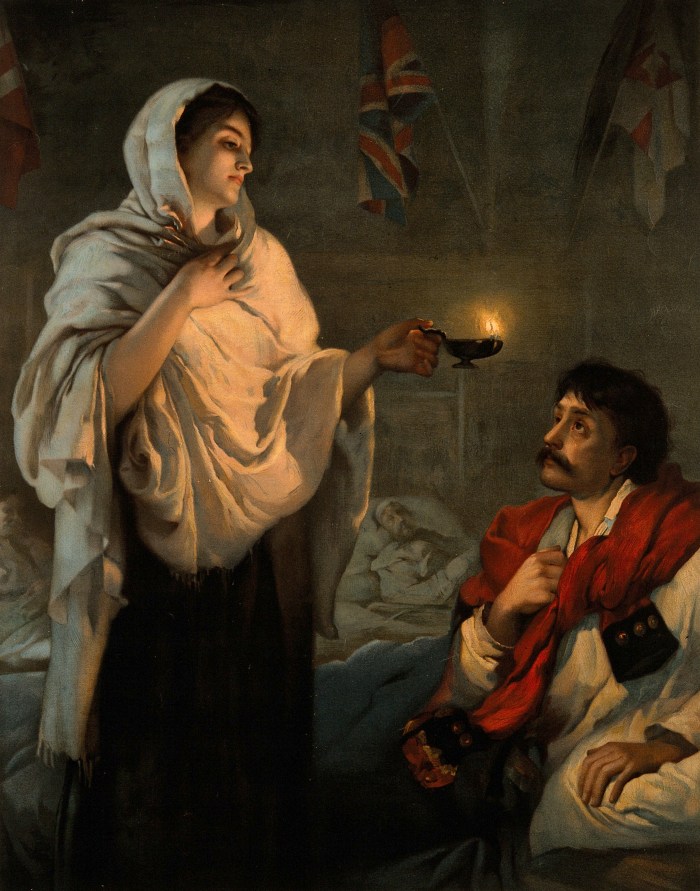
V0006579 Florence Nightingale. Coloured lithograph. Credit: Wellcome Library, London. Wellcome Images images@wellcome.ac.uk http://wellcomeimages.org Florence Nightingale. Coloured lithograph. Published: – Copyrighted work available under Creative Commons Attribution only licence CC BY 4.0 http://creativecommons.org/licenses/by/4.0/
We remember Florence Nightingale as a famous nurse but she was also a writer and statistician, and first female member of the Royal Statistical Society.
Conditions in the Crimean War hospitals was terrible, including overcrowding, poor sanitation and there was a high death rate. Florence wrote, in plain English, about the conditions and used a new form of pie chart to present data on the causes of soldier deaths. Called the Nightingale rose diagram, it showed how many soldiers had died each month of what cause and which deaths were preventable. The diagram starkly revealed that most deaths could have been avoided. She used these easy to understand infographics to persuade Parliament to make changes that saved lives.
As well as increasing people’s understanding of the importance of basic sanitation for soldiers in the Crimean War and in India she also pressed for compulsory toilets in homes. Changes in sanitation over the next 150 years are thought to have increased national life expectancy by 20 years. Data is important to help us make informed decisions but getting the right format to present that data is vital.
Read more about Florence on the cs4fn website.
CLASSROOM IDEAS
Maths & History: Research about Florence’s use of data in the Crimean War. Create a Nightingale rose diagram for some more current data set. Compare this to using other graph types such as a pie chart, bar chart and line graph.
Look at modern infographics and consider how this type of presentation of data might have influenced people in the past on important world issues.
This work was supported by the Institute of Coding, which is supported by the Office for Students (OfS).
